Project 12 Big Mart Sales Prediction
අවුල් සහගත, සැබෑ retail data එකක regression project එකක් — missing values, mixed types, outliers — Parts 1 සිට 4 දක්වා ඉගෙන ගත්ත ඔක්කොම මුල්වතාවට එකට apply වෙන්නෙ මෙතන.
A regression project on messy, real retail data — missing values, mixed types, outliers — where everything from Parts 1 through 4 gets applied together for the first time.
Lesson 48 of 64 · Part 4 · Evaluating & Choosing Models · Hands-on Projects · bilingual notes (English + සිංහල)
Why this matters. A regression project on messy, real retail data — missing values, mixed types, outliers — where everything from Parts 1 through 4 gets applied together for the first time.
සිංහලෙන්: අවුල් සහගත, සැබෑ retail data එකක regression project එකක් — missing values, mixed types, outliers — Parts 1 සිට 4 දක්වා ඉගෙන ගත්ත ඔක්කොම මුල්වතාවට එකට apply වෙන්නෙ මෙතන.
What you'll use this for. Retailers use exactly this kind of model to forecast demand per store, per product — directly informing stocking and staffing decisions.
සිංහලෙන්: Store එකකට, product එකකට demand forecast කරන්න retailers පාවිච්චි කරන්නෙ හරියටම මේ වගේ model එකක් — stocking සහ staffing decisions වලට කෙලින්ම බලපානවා.
Key principles
- Feature engineering often matters more than the choice of algorithm. Creating a smart feature (like "years since establishment" from a raw year column) frequently improves accuracy more than switching from one algorithm to another.
Feature engineering, algorithm එක තෝරගැනීමට වඩා ගොඩක් වෙලාවට වැදගත්
Walkthrough
Importing the Dependencies
import numpy as np
import pandas as pd
import matplotlib.pyplot as plt
import seaborn as sns
from sklearn.preprocessing import LabelEncoder
from sklearn.model_selection import train_test_split
from xgboost import XGBRegressor
from sklearn import metrics
Data Collection and Processing
# loading the data from csv file to Pandas DataFrame
big_mart_data = pd.read_csv('/content/Train.csv')# first 5 rows of the dataframe
big_mart_data.head()| Item_Identifier | Item_Weight | Item_Fat_Content | Item_Visibility | Item_Type | Item_MRP | Outlet_Identifier | … | |
|---|---|---|---|---|---|---|---|---|
| 0 | FDA15 | 9.30 | Low Fat | 0.016047 | Dairy | 249.8092 | OUT049 | … |
| 1 | DRC01 | 5.92 | Regular | 0.019278 | Soft Drinks | 48.2692 | OUT018 | … |
| 2 | FDN15 | 17.50 | Low Fat | 0.016760 | Meat | 141.6180 | OUT049 | … |
| 3 | FDX07 | 19.20 | Regular | 0.000000 | Fruits and Vegetables | 182.0950 | OUT010 | … |
| 4 | NCD19 | 8.93 | Low Fat | 0.000000 | Household | 53.8614 | OUT013 | … |
# number of data points & number of features
big_mart_data.shape
Output
(8523, 12)# getting some information about thye dataset
big_mart_data.info()Output
<class 'pandas.core.frame.DataFrame'>
RangeIndex: 8523 entries, 0 to 8522
Data columns (total 12 columns):
 #   Column                     Non-Null Count  Dtype
---  ------                     --------------  -----
 0   Item_Identifier            8523 non-null   object
 1   Item_Weight                7060 non-null   float64
 2   Item_Fat_Content           8523 non-null   object
 3   Item_Visibility            8523 non-null   float64
 4   Item_Type                  8523 non-null   object
 5   Item_MRP                   8523 non-null   float64
 6   Outlet_Identifier          8523 non-null   object
 7   Outlet_Establishment_Year  8523 non-null   int64
 8   Outlet_Size                6113 non-null   object
 9   Outlet_Location_Type       8523 non-null   object
 10  Outlet_Type                8523 non-null   object
 11  Item_Outlet_Sales          8523 non-null   float64
dtypes: float64(4), int64(1), object(7)
… (1 more lines)
Categorical Features:
- Item_Identifier
- Item_Fat_Content
- Item_Type
- Outlet_Identifier
- Outlet_Size
- Outlet_Location_Type
- Outlet_Type
# checking for missing values
big_mart_data.isnull().sum()
Output
Item_Identifier                 0
Item_Weight                  1463
Item_Fat_Content                0
Item_Visibility                 0
Item_Type                       0
Item_MRP                        0
Outlet_Identifier               0
Outlet_Establishment_Year       0
Outlet_Size                  2410
Outlet_Location_Type            0
Outlet_Type                     0
Item_Outlet_Sales               0
dtype: int64
Handling Missing Values
Mean --> average
Mode --> more repeated value
# mean value of "Item_Weight" column
big_mart_data['Item_Weight'].mean()
Output
12.857645184136183# filling the missing values in "Item_weight column" with "Mean" value
big_mart_data['Item_Weight'].fillna(big_mart_data['Item_Weight'].mean(), inplace=True)# mode of "Outlet_Size" column
big_mart_data['Outlet_Size'].mode()Output
0    Medium
dtype: object# filling the missing values in "Outlet_Size" column with Mode
mode_of_Outlet_size = big_mart_data.pivot_table(values='Outlet_Size', columns='Outlet_Type', aggfunc=(lambda x: x.mode()[0]))print(mode_of_Outlet_size)Output
Outlet_Type Grocery Store Supermarket Type1 Supermarket Type2 Supermarket Type3
Outlet_Size Small Small Medium Mediummiss_values = big_mart_data['Outlet_Size'].isnull()print(miss_values)Output
0       False
1       False
2       False
3        True
4       False
        ...
8518    False
8519     True
8520    False
8521    False
8522    False
Name: Outlet_Size, Length: 8523, dtype: boolbig_mart_data.loc[miss_values, 'Outlet_Size'] = big_mart_data.loc[miss_values,'Outlet_Type'].apply(lambda x: mode_of_Outlet_size[x])# checking for missing values
big_mart_data.isnull().sum()Output
Item_Identifier              0
Item_Weight                  0
Item_Fat_Content             0
Item_Visibility              0
Item_Type                    0
Item_MRP                     0
Outlet_Identifier            0
Outlet_Establishment_Year    0
Outlet_Size                  0
Outlet_Location_Type         0
Outlet_Type                  0
Item_Outlet_Sales            0
dtype: int64
Data Analysis
big_mart_data.describe()| Item_Weight | Item_Visibility | Item_MRP | Outlet_Establishment_Year | Item_Outlet_Sales | |
|---|---|---|---|---|---|
| count | 8523.000000 | 8523.000000 | 8523.000000 | 8523.000000 | 8523.000000 |
| mean | 12.857645 | 0.066132 | 140.992782 | 1997.831867 | 2181.288914 |
| std | 4.226124 | 0.051598 | 62.275067 | 8.371760 | 1706.499616 |
| min | 4.555000 | 0.000000 | 31.290000 | 1985.000000 | 33.290000 |
| 25% | 9.310000 | 0.026989 | 93.826500 | 1987.000000 | 834.247400 |
| 50% | 12.857645 | 0.053931 | 143.012800 | 1999.000000 | 1794.331000 |
… 2 more rows
Numerical Features
sns.set()# Item_Weight distribution
plt.figure(figsize=(6,6))
sns.distplot(big_mart_data['Item_Weight'])
plt.show()Output
/usr/local/lib/python3.7/dist-packages/seaborn/distributions.py:2557: FutureWarning: `distplot` is a deprecated function and will be removed in a future version
  warnings.warn(msg, FutureWarning)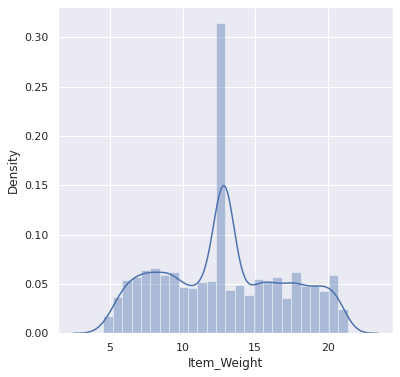
# Item Visibility distribution
plt.figure(figsize=(6,6))
sns.distplot(big_mart_data['Item_Visibility'])
plt.show()
Output
/usr/local/lib/python3.7/dist-packages/seaborn/distributions.py:2557: FutureWarning: `distplot` is a deprecated function and will be removed in a future version
  warnings.warn(msg, FutureWarning)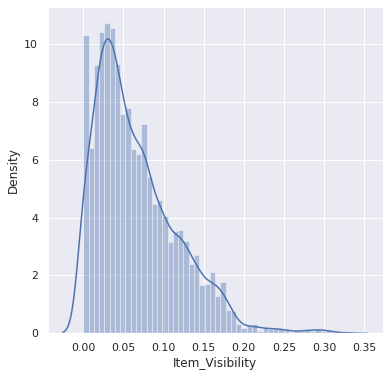
# Item MRP distribution
plt.figure(figsize=(6,6))
sns.distplot(big_mart_data['Item_MRP'])
plt.show()
Output
/usr/local/lib/python3.7/dist-packages/seaborn/distributions.py:2557: FutureWarning: `distplot` is a deprecated function and will be removed in a future version
  warnings.warn(msg, FutureWarning)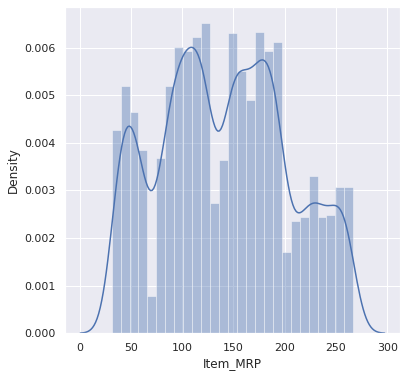
# Item_Outlet_Sales distribution
plt.figure(figsize=(6,6))
sns.distplot(big_mart_data['Item_Outlet_Sales'])
plt.show()
Output
/usr/local/lib/python3.7/dist-packages/seaborn/distributions.py:2557: FutureWarning: `distplot` is a deprecated function and will be removed in a future version
  warnings.warn(msg, FutureWarning)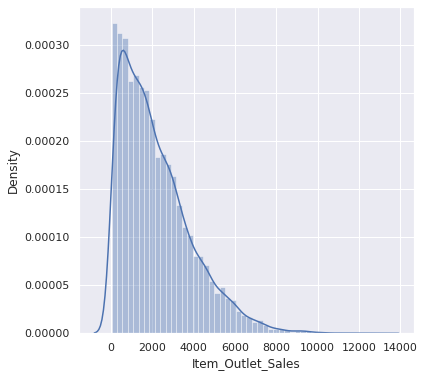
# Outlet_Establishment_Year column
plt.figure(figsize=(6,6))
sns.countplot(x='Outlet_Establishment_Year', data=big_mart_data)
plt.show()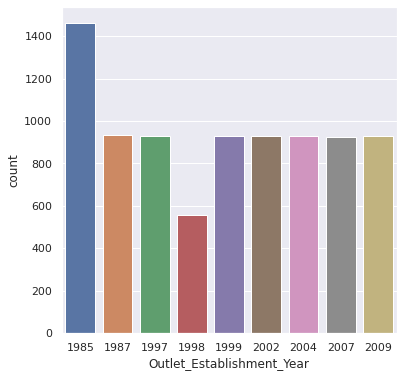
Categorical Features
# Item_Fat_Content column
plt.figure(figsize=(6,6))
sns.countplot(x='Item_Fat_Content', data=big_mart_data)
plt.show()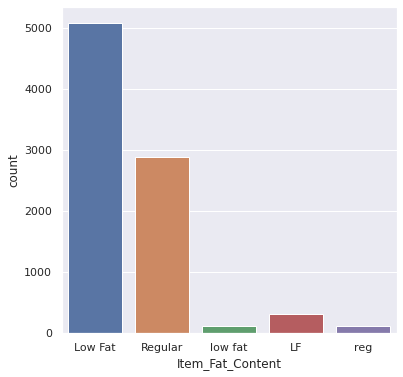
# Item_Type column
plt.figure(figsize=(30,6))
sns.countplot(x='Item_Type', data=big_mart_data)
plt.show()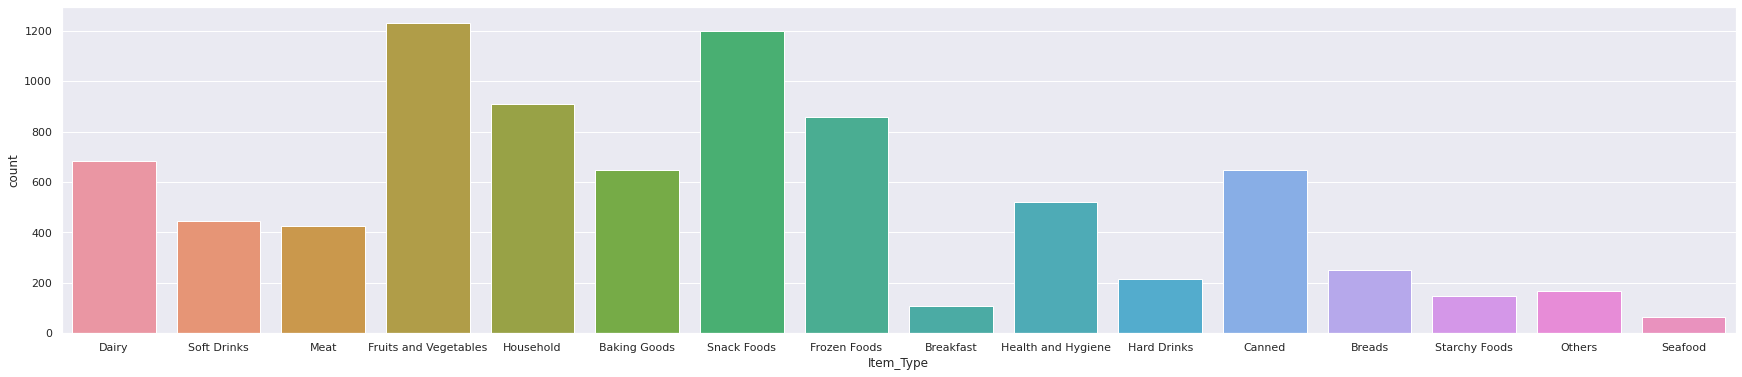
# Outlet_Size column
plt.figure(figsize=(6,6))
sns.countplot(x='Outlet_Size', data=big_mart_data)
plt.show()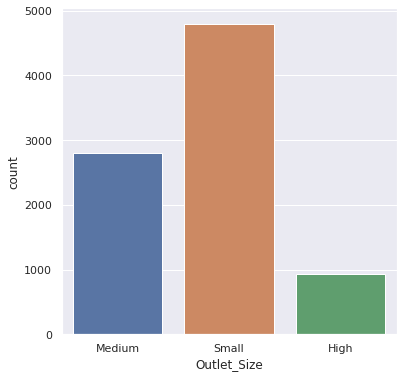
Data Pre-Processing
big_mart_data.head()| Item_Identifier | Item_Weight | Item_Fat_Content | Item_Visibility | Item_Type | Item_MRP | Outlet_Identifier | … | |
|---|---|---|---|---|---|---|---|---|
| 0 | FDA15 | 9.30 | Low Fat | 0.016047 | Dairy | 249.8092 | OUT049 | … |
| 1 | DRC01 | 5.92 | Regular | 0.019278 | Soft Drinks | 48.2692 | OUT018 | … |
| 2 | FDN15 | 17.50 | Low Fat | 0.016760 | Meat | 141.6180 | OUT049 | … |
| 3 | FDX07 | 19.20 | Regular | 0.000000 | Fruits and Vegetables | 182.0950 | OUT010 | … |
| 4 | NCD19 | 8.93 | Low Fat | 0.000000 | Household | 53.8614 | OUT013 | … |
big_mart_data['Item_Fat_Content'].value_counts()Output
Low Fat    5089
Regular    2889
LF          316
reg         117
low fat     112
Name: Item_Fat_Content, dtype: int64big_mart_data.replace({'Item_Fat_Content': {'low fat':'Low Fat','LF':'Low Fat', 'reg':'Regular'}}, inplace=True)big_mart_data['Item_Fat_Content'].value_counts()Output
Low Fat    5517
Regular    3006
Name: Item_Fat_Content, dtype: int64
Label Encoding
encoder = LabelEncoder()big_mart_data['Item_Identifier'] = encoder.fit_transform(big_mart_data['Item_Identifier'])
big_mart_data['Item_Fat_Content'] = encoder.fit_transform(big_mart_data['Item_Fat_Content'])
big_mart_data['Item_Type'] = encoder.fit_transform(big_mart_data['Item_Type'])
big_mart_data['Outlet_Identifier'] = encoder.fit_transform(big_mart_data['Outlet_Identifier'])
big_mart_data['Outlet_Size'] = encoder.fit_transform(big_mart_data['Outlet_Size'])
big_mart_data['Outlet_Location_Type'] = encoder.fit_transform(big_mart_data['Outlet_Location_Type'])
big_mart_data['Outlet_Type'] = encoder.fit_transform(big_mart_data['Outlet_Type'])big_mart_data.head()| Item_Identifier | Item_Weight | Item_Fat_Content | Item_Visibility | Item_Type | Item_MRP | Outlet_Identifier | … | |
|---|---|---|---|---|---|---|---|---|
| 0 | 156 | 9.30 | 0 | 0.016047 | 4 | 249.8092 | 9 | … |
| 1 | 8 | 5.92 | 1 | 0.019278 | 14 | 48.2692 | 3 | … |
| 2 | 662 | 17.50 | 0 | 0.016760 | 10 | 141.6180 | 9 | … |
| 3 | 1121 | 19.20 | 1 | 0.000000 | 6 | 182.0950 | 0 | … |
| 4 | 1297 | 8.93 | 0 | 0.000000 | 9 | 53.8614 | 1 | … |
Splitting features and Target
X = big_mart_data.drop(columns='Item_Outlet_Sales', axis=1)
Y = big_mart_data['Item_Outlet_Sales']print(X)Output
      Item_Identifier  Item_Weight  ...  Outlet_Location_Type  Outlet_Type
0                 156        9.300  ...                     0            1
1                   8        5.920  ...                     2            2
2                 662       17.500  ...                     0            1
3                1121       19.200  ...                     2            0
4                1297        8.930  ...                     2            1
...               ...          ...  ...                   ...          ...
8518              370        6.865  ...                     2            1
8519              897        8.380  ...                     1            1
8520             1357       10.600  ...                     1            1
8521              681        7.210  ...                     2            2
8522               50       14.800  ...                     0            1

[8523 rows x 11 columns]print(Y)Output
0       3735.1380
1        443.4228
2       2097.2700
3        732.3800
4        994.7052
          ...
8518    2778.3834
8519     549.2850
8520    1193.1136
8521    1845.5976
8522     765.6700
Name: Item_Outlet_Sales, Length: 8523, dtype: float64
Splitting the data into Training data & Testing Data
X_train, X_test, Y_train, Y_test = train_test_split(X, Y, test_size=0.2, random_state=2)print(X.shape, X_train.shape, X_test.shape)Output
(8523, 11) (6818, 11) (1705, 11)Machine Learning Model Training
XGBoost Regressor
regressor = XGBRegressor()regressor.fit(X_train, Y_train)Output
[02:56:53] WARNING: /workspace/src/objective/regression_obj.cu:152: reg:linear is now deprecated in favor of reg:squarederror.Output
XGBRegressor(base_score=0.5, booster='gbtree', colsample_bylevel=1,
             colsample_bynode=1, colsample_bytree=1, gamma=0,
             importance_type='gain', learning_rate=0.1, max_delta_step=0,
             max_depth=3, min_child_weight=1, missing=None, n_estimators=100,
             n_jobs=1, nthread=None, objective='reg:linear', random_state=0,
             reg_alpha=0, reg_lambda=1, scale_pos_weight=1, seed=None,
             silent=None, subsample=1, verbosity=1)
Evaluation
# prediction on training data
training_data_prediction = regressor.predict(X_train)# R squared Value
r2_train = metrics.r2_score(Y_train, training_data_prediction)print('R Squared value = ', r2_train)Output
R Squared value = 0.6364457030941357# prediction on test data
test_data_prediction = regressor.predict(X_test)# R squared Value
r2_test = metrics.r2_score(Y_test, test_data_prediction)print('R Squared value = ', r2_test)Output
R Squared value = 0.5867640914432671Keep going: ← Lesson 47 · Lesson 49 → · Track it in the Self Guide
Finished this one?
Part of Self Guide · Stage 16: ML 4 — Evaluating & Choosing Models. Progress is saved in this browser.