Vector Operations in Python Part 1
ඔයාගෙ dataset එකේ row එකක් — රෝගියෙකුගෙ, නිවසක එක් feature එකක්ම — ඇත්තටම vector එකක්. ඉගෙන ගන්න ML formula ඕනම එකක් තියෙන්නෙ vector maths එකක් වෙස්ගැන්වෙලා.
A row in your dataset — every feature of one patient, one house — is literally a vector. Every ML formula you'll meet is vector maths in disguise.
Lesson 25 of 64 · Part 2 · Maths & First Models · Maths for ML · bilingual notes (English + සිංහල)
Why this matters. A row in your dataset — every feature of one patient, one house — is literally a vector. Every ML formula you'll meet is vector maths in disguise.
සිංහලෙන්: ඔයාගෙ dataset එකේ row එකක් — රෝගියෙකුගෙ, නිවසක එක් feature එකක්ම — ඇත්තටම vector එකක්. ඉගෙන ගන්න ML formula ඕනම එකක් තියෙන්නෙ vector maths එකක් වෙස්ගැන්වෙලා.
What you'll use this for. The dot product you learn here is, almost unchanged, the exact calculation Linear Regression uses to make a prediction.
සිංහලෙන්: මෙතන ඉගෙන ගන්න dot product එක, එහෙම ම කිට්ටුවෙන්, Linear Regression එකෙන් prediction එකක් හදන ගණනයමයි.
Key principles
- A vector is just an ordered list of numbers with meaning attached. [age, income, years_experience] is a 3-dimensional vector — nothing more mysterious than that.
Vector එකක් කියන්නෙ අර්ථයක් තියෙන, පිළිවෙළකට තියෙන numbers ලැයිස්තුවක් විතරයි
Walkthrough
import numpy as np
import matplotlib.pyplot as plt
import seaborn as snssns.set()Plotting a vector
plt.quiver(0,0,4,5)
plt.show()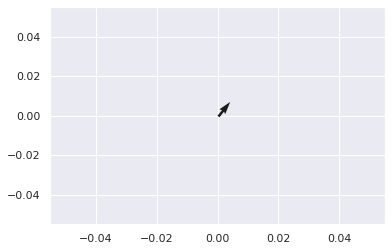
plt.quiver(0,0,4,5, scale_units='xy', angles='xy', scale=1)
plt.xlim(-8,8)
plt.ylim(-8,8)
plt.show()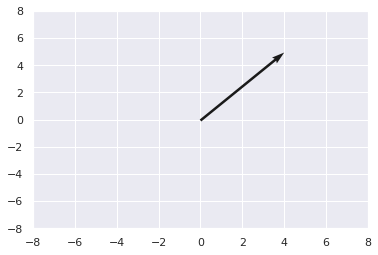
plt.quiver(0,0,4,5, scale_units='xy', angles='xy', scale=1, color='b')
plt.xlim(-8,8)
plt.ylim(-8,8)
plt.show()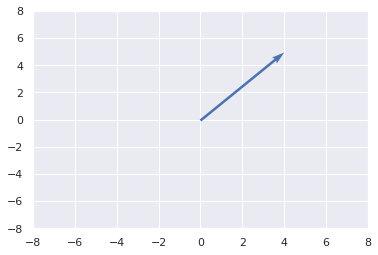
plt.quiver(0,0,4,5, scale_units='xy', angles='xy', scale=1, color='b')
plt.quiver(0,0,-3,-6, scale_units='xy', angles='xy', scale=1, color='y')
plt.xlim(-8,8)
plt.ylim(-8,8)
plt.show()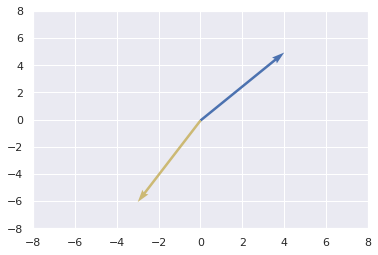
Addition of two Vectors
vector_1 = np.asarray([0,0,2,3])

vector_2 = np.asarray([0,0,3,-2])

sum = vector_1 + vector_2
print(sum)
Output
[0 0 5 1]plt.quiver(0,0,2,3, scale_units='xy', angles='xy', scale=1, color='b')
plt.quiver(0,0,3,-2, scale_units='xy', angles='xy', scale=1, color='y')
plt.quiver(0,0,5,1, scale_units='xy', angles='xy', scale=1, color='r')
plt.xlim(-8,8)
plt.ylim(-8,8)
plt.show()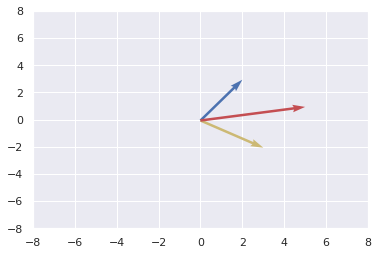
Subtraction of 2 vectors
vector_1 = np.asarray([0,0,2,3])

vector_2 = np.asarray([0,0,3,-2])

difference = vector_1 - vector_2
print(difference)
Output
[ 0 0 -1 5]plt.quiver(0,0,2,3, scale_units='xy', angles='xy', scale=1, color='b')
plt.quiver(0,0,3,-2, scale_units='xy', angles='xy', scale=1, color='y')
plt.quiver(0,0,-1,5, scale_units='xy', angles='xy', scale=1, color='r')
plt.xlim(-8,8)
plt.ylim(-8,8)
plt.show()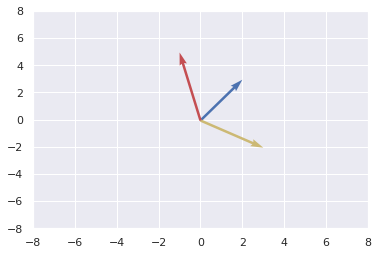
Multiplying a vector by a scalar
vector_1 = np.asarray([0,0,2,3])

vector_2 = 2*vector_1

print(vector_2)
Output
[0 0 4 6]plt.quiver(0,0,2,3, scale_units='xy', angles='xy', scale=1, color='b')
plt.quiver(0,0,4,6, scale_units='xy', angles='xy', scale=1, color='y')
plt.xlim(-8,8)
plt.ylim(-8,8)
plt.show()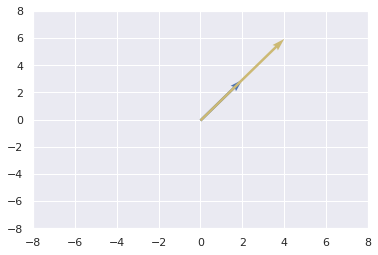
vector_1 = np.asarray([0,0,2,3])

vector_2 = -0.5*vector_1

print(vector_2)
Output
[-0. -0. -1. -1.5]plt.quiver(0,0,2,3, scale_units='xy', angles='xy', scale=1, color='b')
plt.quiver(0,0,-1,-1.5, scale_units='xy', angles='xy', scale=1, color='y')
plt.xlim(-8,8)
plt.ylim(-8,8)
plt.show()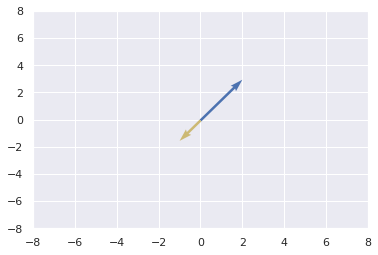
Keep going: ← Lesson 24 · Lesson 26 → · Track it in the Self Guide
Finished this one?
Part of Self Guide · Stage 14: ML 2 — Maths & First Models. Progress is saved in this browser.